Image Details
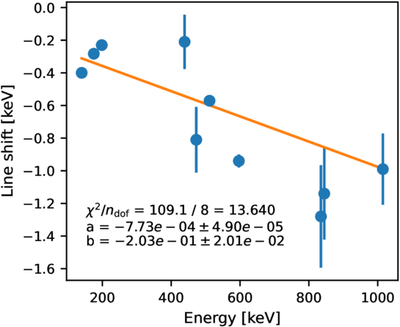
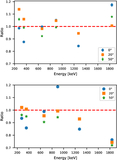
Caption: Figure 7.
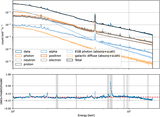
Difference of the centroids of the peaks between data (PE) and simulation for some activation lines as a function of the energy after applying the additional preamplifier temperature correction. A linear fit y = a ∗ x + b is represented in orange.
Other Images in This Article

Show More
Copyright and Terms & Conditions
© 2025. The Author(s). Published by the American Astronomical Society.
Copyright ©
2025 Astronomy Image Explorer. All Rights Reserved.