Image Details
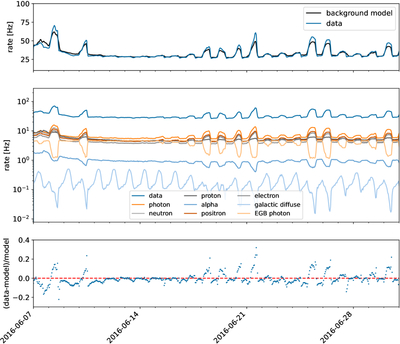
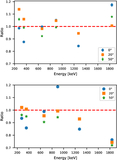
Caption: Figure 14.
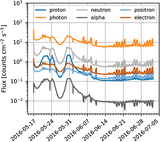
Top: rate comparison of the PE events between data (blue) and the total background model (in black) for the period 2016 June 7 to 2016 July 1. The rate is integrated between 0.1 and 1.6 MeV. Middle: similar to the upper plot but for each component of the model. Bottom: residuals between data and total background model.
Other Images in This Article
Show More
Copyright and Terms & Conditions
© 2025. The Author(s). Published by the American Astronomical Society.
Copyright ©
2025 Astronomy Image Explorer. All Rights Reserved.