Image Details
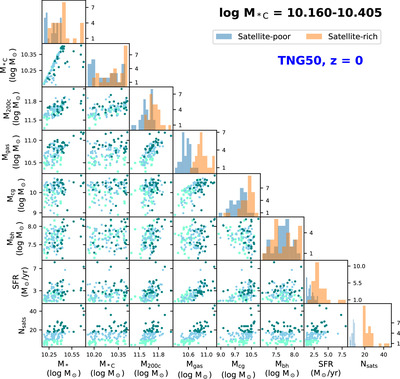
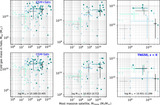
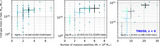
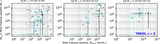
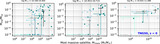
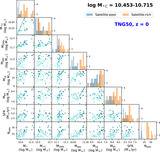
Caption: Figure A1.
Scatter plots for the low-mass bin (log M*C = 10.160–10.405) halos probing correlations between the number of satellite galaxies per halo (Nsats), M*, M*C, M200c, Mgas, Mcg, Mbh (all in log M⊙), and SFR (in M⊙ yr−1). The 25th (Satellite-poor), 50th, and 75th (Satellite-rich) quartiles are shown as aqua, blue, and teal points, respectively. Histograms for the satellite-poor and satellite-rich quartiles for corresponding halo attributes are also shown in the form of blue and orange bars, respectively.
Other Images in This Article
Copyright and Terms & Conditions
© 2025. The Author(s). Published by the American Astronomical Society.
Copyright ©
2026 Astronomy Image Explorer. All Rights Reserved.