Image Details
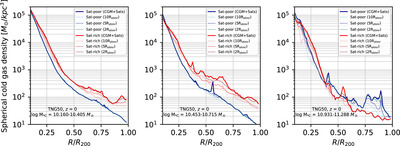
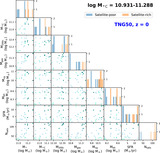
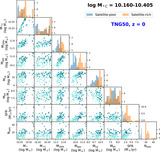
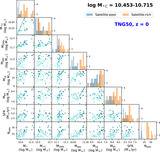
Caption: Figure B1.
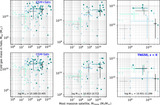
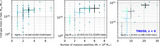
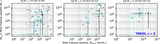
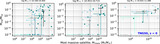
Same as Figure 1 but now also with two other radial cuts for the satellite populations. This time along with plotting all cold gas at r ≳ 10.0· R0.5 (i.e., CGM-Satellites case; dashed light blue and light red) of each satellite within a halo, we also show the mean cold gas spherical densities for R5 (r ≳ 5.0· R0.5; dashed dark blue and dark red) and R2 (r ≳ 2.0· R0.5; dashed teal and maroon). As before, the density profiles for the CGM+Satellites case are depicted with solid lines. Thus, the difference between similarly colored dashed lines is an indicator of the cold gas lying solely in the extended environments of satellites.
Other Images in This Article
Copyright and Terms & Conditions
© 2025. The Author(s). Published by the American Astronomical Society.