Image Details
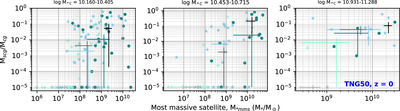
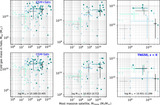
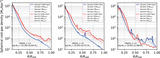
Caption: Figure 7.
Total cold gas mass within R10 of all satellites (Mscg) upon the total halo cold gas mass (Mcg) vs. stellar mass of the most massive satellite, M*mms (in M⊙). The left, middle, and right panels show log M*C = 10.160–10.405, log M*C = 10.453–10.715, and log M*C = 10.931–11.288 bin halos. As in earlier figures, respective quartiles and 1σ ranges are marked. Since some satellite populations are totally devoid of any cold gas within their R10 regions, we set their y-axis values to 10−5. This figure helps us directly quantify the ratio of the total halo cold gas mass coming from the R10 regions of the satellite population. While the median contributions from satellites toward the host cold gas mass are <10%, some individual cases show as much as ∼ 70%–80% of the halo cold gas associated with their corresponding satellite populations.
Other Images in This Article
Copyright and Terms & Conditions
© 2025. The Author(s). Published by the American Astronomical Society.