Image Details
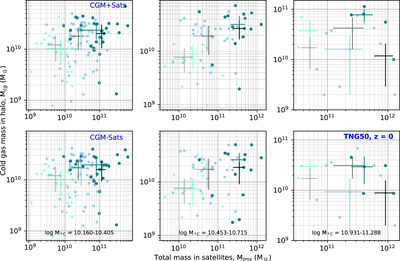
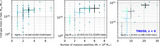
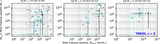
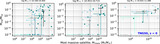
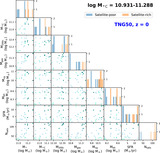
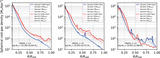
Caption: Figure 3.
Total cold gas mass per halo, Mcg, (in M⊙) vs. total mass in all satellite galaxies per halo, Mtms (in M⊙) for CGM+Satellites (top panels) and CGM-Satellites (bottom panels) for the log M*C = 10.160–10.405 (left panels), log M*C = 10.453–10.715 (middle panels), and log M*C = 10.931–11.288 (right panels) bin halos. As in Figure 2, the numbers of satellite-based medians (﹩{\bar{N}}_{\mathrm{sats}}﹩) are represented by colored cross symbols. Mtms-based median values (﹩{\bar{M}}_{\mathrm{tms}}﹩) are shown as light gray, gray, and black crosses, respectively.
Other Images in This Article
Copyright and Terms & Conditions
© 2025. The Author(s). Published by the American Astronomical Society.
Copyright ©
2026 Astronomy Image Explorer. All Rights Reserved.