Image Details

Caption: Figure 1.
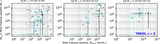
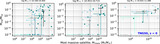
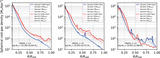
Left to right panels: comparison between the mean cold gas spherical densities (in M⊙ kpc−3) as a function of normalized radius for CGM+Satellites (solid lines) and CGM-Satellites (dashed lines), for TNG50 halos belonging to the low-mass (log M*C = 10.160–10.405), middle-mass (log M*C = 10.453–10.715), and high-mass bins (log M*C = 10.931–11.288), for the 25th (blue) and 75th (red) quartiles. Regions within 0.1R200 have been excluded to avoid ISM. Shaded blue (red) regions indicate the 16th–84th percentiles for the respective CGM-Satellites cases. Note how differences start creeping between CGM+Satellites and CGM-Satellites mostly in regions at distances ≳0.4R200, directly indicating the influence satellites have on the cold gas profiles of galaxies.
Other Images in This Article
Copyright and Terms & Conditions
© 2025. The Author(s). Published by the American Astronomical Society.