

Image Details
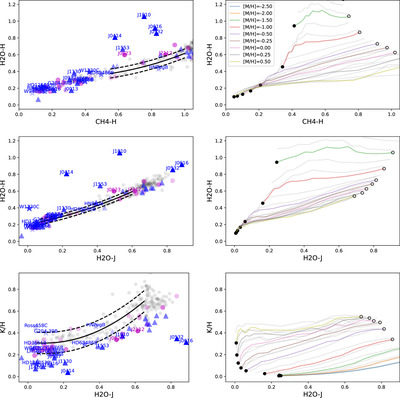
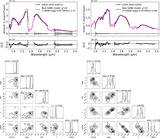
Caption: Figure 15.
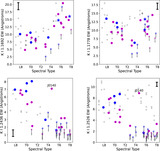
Left panels: three of the spectral index pairings that segregate metal-poor and solar-metallicity late-L and -T dwarfs. Previously classified subdwarfs are indicated by blue triangles, T dwarf benchmarks are indicated by blue stars, local T dwarfs are indicated by gray circles, and observed candidates are indicated by magenta circles. The transparency of each symbol is based on the metallicity class, with dwarfs being most transparent and extreme subdwarfs being most opaque. Sources identified as sdT or esdT and all benchmarks are labeled. Solid and dashed lines trace the mean and ±1σ standard deviation for second-order polynomial fits to the local T dwarf sample over the ranges specified in Table 12. Right panels: same index pairings measured on LOWZ models for 600 K ≤Teff ≤ 1600 K (filled to open circles) and −2.5 ≤ [M/H] ≤ +0.5 (colored lines). The color lines trace ﹩\mathrm{log}g﹩ = 5.0 (cgs), while the semitransparent gray lines trace ﹩\mathrm{log}g﹩ = 4.0 and 5.25.
Other Images in This Article
Show More
Copyright and Terms & Conditions
© 2025. The Author(s). Published by the American Astronomical Society.

