

Image Details
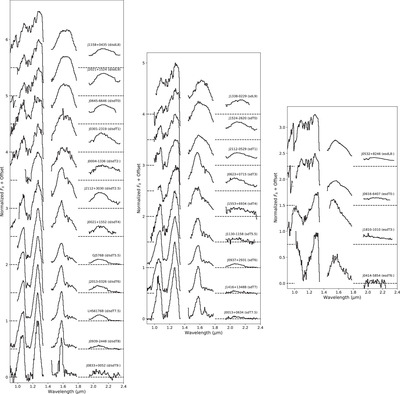
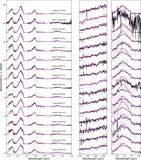
Caption: Figure 13.
Spectral sequences for mild subdwarfs (d/sd; left), subdwarfs (sd; middle) and extreme subdwarfs (esd; right) for late-L and -T dwarfs in our spectral sample. All data are smoothed to an equivalent resolution of λ/Δλ = 300, normalized at the 1.25 μm peak and offset by constants (dashed lines; 0.5 steps for d/sd and sd, 0.75 steps for esd). Standards are identified by name and spectral type.
(The data used to create this figure are available in the online article.)
(The data used to create this figure are available.)
Other Images in This Article
Show More
Copyright and Terms & Conditions
© 2025. The Author(s). Published by the American Astronomical Society.

Copyright ©
2026 Astronomy Image Explorer. All Rights Reserved.
