Image Details
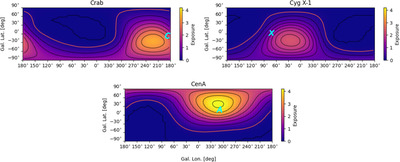
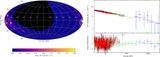
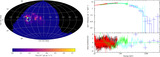
Caption: Figure 5.
Exposure maps of the three sources during the 2016 balloon flight. The cyan letters C, X, and A represent the known source locations of Crab, Cyg X-1, and Cen A, respectively. The black contours represent the different thresholds of exposure, and the red contour represents the minimum exposure limit for pixels to be included in the RL image. The color map shows the instrument exposure in units of 108 s cm2 sr−1.
Other Images in This Article
Copyright and Terms & Conditions
© 2025. The Author(s). Published by the American Astronomical Society.
Copyright ©
2025 Astronomy Image Explorer. All Rights Reserved.