Image Details
Caption: Figure 4.
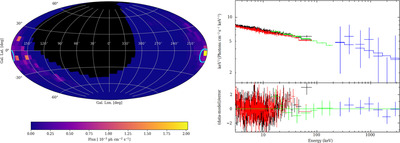
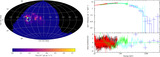
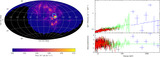
Left: Crab image generated from the 2016 COSI-Balloon flight data. The pixels are separated into 6◦ bins, and the cyan circle drawn at the known source location with an ARM radius of 8° is shown to represent the instrument angular resolution for the energy bin 325–480 keV. Right: Crab spectrum as measured by NuSTAR (black, red), Swift/BAT (green), and the COSI-Balloon instrument (blue), fit with a broken power law. The fit has a reduced-χ2 value of 1.08 (see Table 2).
Other Images in This Article
Copyright and Terms & Conditions
© 2025. The Author(s). Published by the American Astronomical Society.
Copyright ©
2025 Astronomy Image Explorer. All Rights Reserved.