Image Details
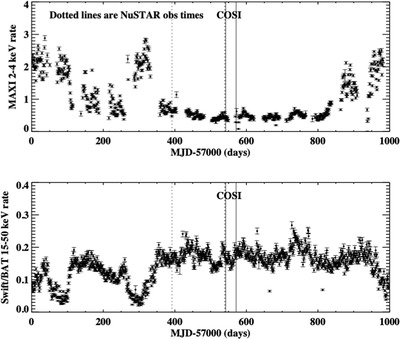
Caption: Figure 6.
Cygnus X-1 flux measured by MAXI and Swift-BAT during the COSI-Balloon 2016 flight. The COSI-Balloon flight period is marked by solid vertical lines, and the two NuSTAR observations considered for this analysis in the combined spectrum are marked by two vertical dashed lines. The low 2–4 keV count rate measured by MAXI and the high 15–50 keV count rate measured by Swift-BAT are strong indicators that Cyg X-1 was in the LHS during the COSI-Balloon observations.
Other Images in This Article
Copyright and Terms & Conditions
© 2025. The Author(s). Published by the American Astronomical Society.
Copyright ©
2025 Astronomy Image Explorer. All Rights Reserved.