Image Details
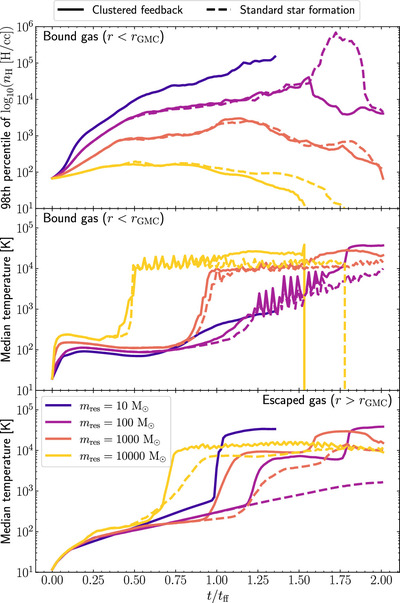
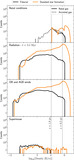
Caption: Figure 9.
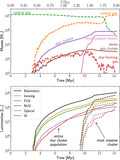
Comparison of the effect of the clustered-feedback prescription (solid lines) relative to the standard model of star formation (dashed lines): panels show the time evolution of the 98th percentile of the bound gas density distribution (top), and the median temperatures among the bound (r < r GMC, middle) and escaped gas (r > r GMC, bottom). Line colors correspond to different gas mass resolution.
Other Images in This Article
Show More
Copyright and Terms & Conditions
© 2024. The Author(s). Published by the American Astronomical Society.
Copyright ©
2025 Astronomy Image Explorer. All Rights Reserved.