Image Details
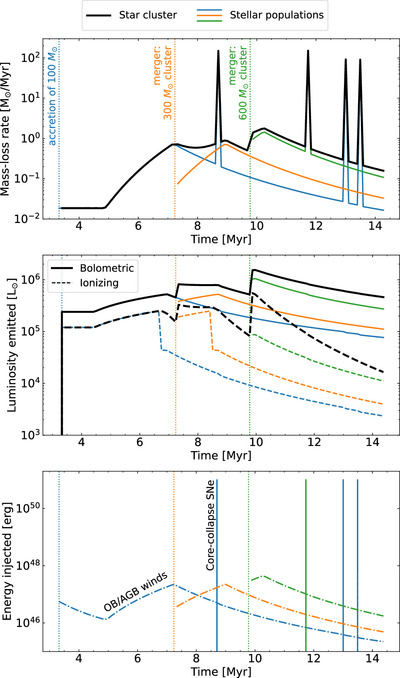
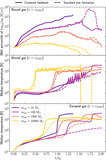
Caption: Figure 2.
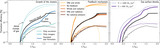
Evolution of the feedback products ejected by a representative star cluster (black line), with contributions of its three stellar populations shown as blue, orange, and green lines. Top: mass-loss rate due to CC SNe and OB/AGB winds. Middle: bolometric (solid) and ionizing (dashed lines) luminosities. Bottom: energy injected by CC SNe events (solid lines) as well as the continuous kinetic energy injected due to OB/AGB mass loss (dashed–dotted lines). Dotted vertical lines indicate events of mass growth for the star cluster and are labeled in the top panel.
Other Images in This Article
Show More
Copyright and Terms & Conditions
© 2024. The Author(s). Published by the American Astronomical Society.
Copyright ©
2025 Astronomy Image Explorer. All Rights Reserved.