Image Details
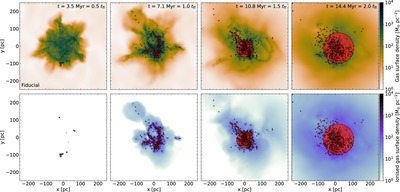
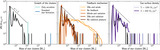
Caption: Figure 3.
Time evolution of the projected gas surface density (top row) and the projected ionized gas surface density (bottom row) of the fiducial cloud at three representative times (0.5t ff, t ff, and 1.5t ff). The star clusters are represented by red markers, scaled by mass. The black markers indicate sinks without stellar populations, i.e., representing dense clumps of gas.
Other Images in This Article
Show More
Copyright and Terms & Conditions
© 2024. The Author(s). Published by the American Astronomical Society.
Copyright ©
2025 Astronomy Image Explorer. All Rights Reserved.