Image Details
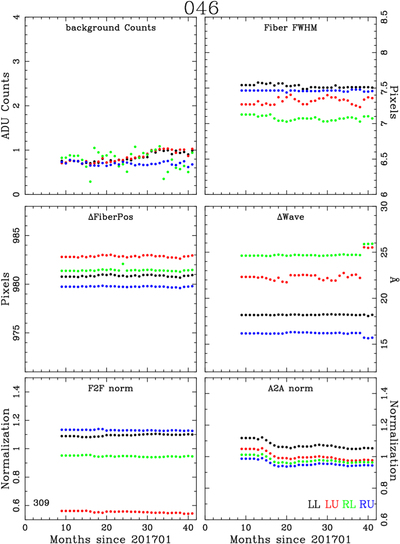
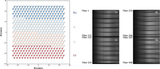
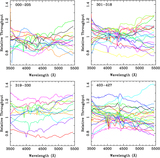
Caption: Figure 6.
Variations in the calibration of one typical IFU over three years of operation. Plots like these enable us to look for trends in the calibration of all IFUs in the VIRUS array. This set of data is for IFUslot 046, which feeds spectrograph 309. The six checks we apply are: background count level (top left), FWHM in pixels across the fiber profile (top right), separation in pixels between the first and last (112th) fiber on an amplifier (middle left), change in the wavelength solution (in Å) from the corner fibers of the IFU (middle right), normalization differences between the ratio of the corner fibers of the IFU (bottom left), and the overall normalization of the particular amplifier compared to the average of all the amplifiers in all the spectrographs (bottom right). The colors represent the four amplifiers of the IFU, with LL in black, LU in red, RL in green, and RU in blue.
Other Images in This Article
Show More
Copyright and Terms & Conditions
© 2021. The Author(s). Published by the American Astronomical Society.