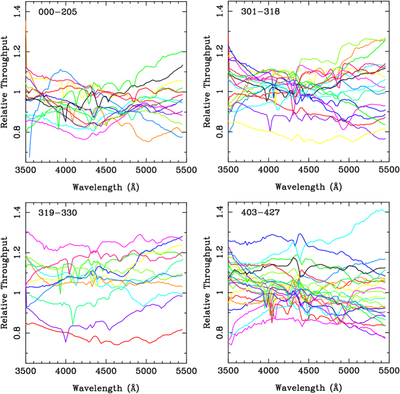
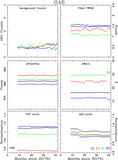
Image Details

Choose export citation format:

The Hobby–Eberly Telescope Dark Energy Experiment (HETDEX) Survey Design, Reductions, and Detections

  • Authors: Karl Gebhardt, Erin Mentuch Cooper, Robin Ciardullo, Viviana Acquaviva, Ralf Bender, William P. Bowman, Barbara G. Castanheira, Gavin Dalton, Dustin Davis, Roelof S. de Jong, D. L. DePoy, Yaswant Devarakonda, Sun Dongsheng, Niv Drory, Maximilian Fabricius, Daniel J. Farrow, John Feldmeier, Steven L. Finkelstein, Cynthia S. Froning, Eric Gawiser, Caryl Gronwall, Laura Herold, Gary J. Hill, Ulrich Hopp, Lindsay R. House, Steven Janowiecki, Matthew Jarvis, Donghui Jeong, Shardha Jogee, Ryota Kakuma, Andreas Kelz, W. Kollatschny, Eiichiro Komatsu, Mirko Krumpe, Martin Landriau, Chenxu Liu, Maja Lujan Niemeyer, Phillip MacQueen, Jennifer Marshall, Ken Mawatari, Emily M. McLinden, Shiro Mukae, Gautam Nagaraj, Yoshiaki Ono, Masami Ouchi, Casey Papovich, Nao Sakai, Shun Saito, Donald P. Schneider, Andreas Schulze, Khavvia Shanmugasundararaj, Matthew Shetrone, Chris Sneden, Jan Snigula, Matthias Steinmetz, Benjamin P. Thomas, Brianna Thomas, Sarah Tuttle, Tanya Urrutia, Lutz Wisotzki, Isak Wold, Gregory Zeimann, and Yechi Zhang

2021 The Astrophysical Journal 923 217.

  • Provider: AAS Journals

Caption: Figure 10.

Relative throughput measures of amplifier LL versus wavelength for each spectrograph. Each panel presents data from a different set of spectrographs, where the spectrograph identification is given in the label near the top. The spectrographs with higher numbers are those installed at a later time and generally have higher relative throughput by about 10%. Each curve is based on the average of 112 fiber-to-fiber profiles within the amplifier. We use these curves to determine the relative throughput calibration over all IFUs.

Other Images in This Article

Show More

Copyright and Terms & Conditions