Image Details
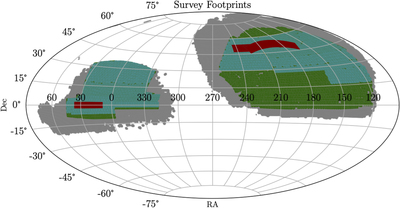
Caption: Figure 1.
The HETDEX field compared to overlapping large-area surveys. The red regions display the 540 deg2 baseline fields of HETDEX. The green, cyan and gray areas show, respectively, the BOSS (Dawson et al. 2013), eBOSS (Dawson et al. 2016), and DESI (DESI Collaboration et al. 2016) footprints.
Other Images in This Article
Show More
Copyright and Terms & Conditions
© 2021. The Author(s). Published by the American Astronomical Society.
Copyright ©
2025 Astronomy Image Explorer. All Rights Reserved.