Image Details
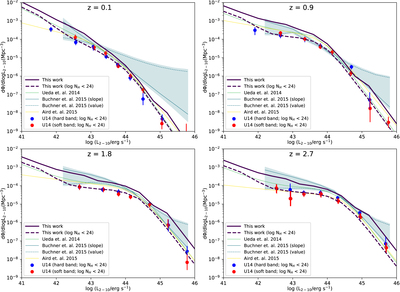
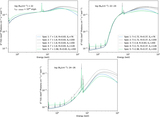
Caption: Figure 9.
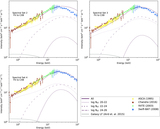
Number of objects per comoving Mpc3 against log Lx for z = 0.1 (top left), z = 0.9 (top right), z = 1.8 (bottom left), and z = 2.7 (bottom right), summed over all absorption bins, including Compton-thick objects (solid lines), and summed in the log NH = 20–24 bins (dashed lines). The models are this work (purple lines), U14 (light-green line), A15 (yellow lines), B15 median of constant slope prior (gray solid lines), and median of constant value prior (gray dashed lines). The shaded gray region is B15 uncertainty (1st–99th percentile). The blue and red data points are binned counts in the log NH = 20–24 range from Ueda et al. (2014), in the hard- and soft-X-ray-selected bands, respectively. The overall XLF in the log NH = 20–24 for this work (dashed purple line) is also given for comparison with data points.
Other Images in This Article
Show More
Copyright and Terms & Conditions
© 2019. The American Astronomical Society. All rights reserved.