Image Details
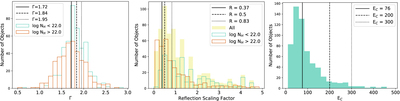
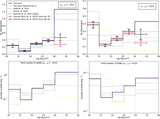
Caption: Figure 5.
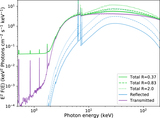
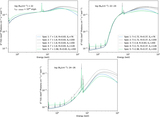
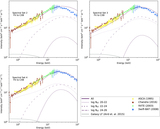
AGN power-law spectral photon index (left), reflection scaling factor (middle), and cutoff energy (right) distributions for the Swift-BAT 70-month sample (Ricci et al. 2017). In the left and middle panels, the unabsorbed and absorbed population Γ distributions are plotted in two distinct histograms, log (NH/cm−2) < 22 (light green) and log (NH/cm−2) > 22 (orange). Most of the reflection scaling factor values are upper limits, whereas most of the cutoff energy values are lower limits. Ueda et al. (2014) parameter values are indicated by black solid and dashed vertical lines in the left and middle panels. In the right panel, the U14 cutoff energy, EC = 300 keV, is shown with the dotted line, and the Swift-BAT 70-month observed median (EC = 76 keV) and bias-corrected median (EC = 200 keV) are shown with solid and dashed lines, respectively.
Other Images in This Article
Show More
Copyright and Terms & Conditions
© 2019. The American Astronomical Society. All rights reserved.