Image Details

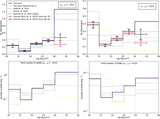
Caption: Figure 1.
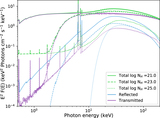
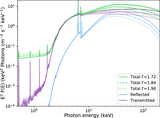
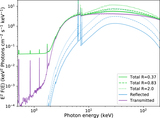
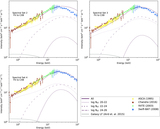
Observed-frame spectra with intrinsic L2−10 = 1044 erg s−1, log (NH/cm−2) = 23 at z = 0.002 (solid lines) and z = 1 (dashed lines) in the top panel and z = 3 (dotted lines) in the bottom panel. The plot shows the unabsorbed component scattered by gas outside the torus region (dark-gray lines), the reflection component (light-blue lines) from the accretion disk, transmitted emission (purple lines) from the torus, the total AGN spectra (light-green lines), and the window of observation in typical energy bands. Chandra observes in the 0.5–8 keV band, and XMM-Newton observes in the 0.5–10 keV band, Swift-BAT in the 14−195 keV band, and NuSTAR in the 3–79 keV band at this redshift. At z = 1.0, the observed flux is six orders of magnitude lower than in the local universe owing to distance, while redshifting allows the instruments to probe higher rest-frame energy bands. The Chandra and XMM hard bands and, to a larger extent, NuSTAR play a vital role in quantifying the strength of the reflection component.
Other Images in This Article
Show More
Copyright and Terms & Conditions
© 2019. The American Astronomical Society. All rights reserved.