Image Details
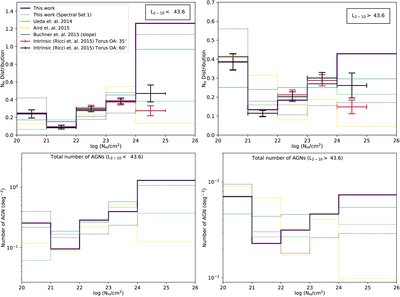
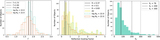
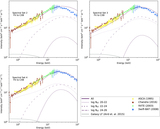
Caption: Figure 10.
NH distributions assumed for the present work and for previous population synthesis models. Top panels: NH distributions for various models, integrated up to z ≃ 0.1 (solid lines), including the completeness-corrected (Ricci et al. 2015) distributions assuming two different geometries for the torus: an opening angle of 60° (black plus sign) and an opening angle of 35° (red plus sign). The observations are in the ﹩\mathrm{log}({N}_{{\rm{H}}}/{\mathrm{cm}}^{-2})=20\mbox{--}25﹩ range. The models are this work (purple line), Spectral Set 1 (dotted purple line, also from this work), U14 (light-green line), A15 (yellow line), and B15 (median of constant slope prior; gray solid line). All models assume that the number densities of objects in the ﹩\mathrm{log}({N}_{{\rm{H}}}/{\mathrm{cm}}^{-2})=24\mbox{--}25﹩ bin are equal to those of the ﹩\mathrm{log}({N}_{{\rm{H}}}/{\mathrm{cm}}^{-2})=25\mbox{--}26﹩ bin for all redshifts and luminosities, as there are very few data to constrain the ﹩\mathrm{log}({N}_{{\rm{H}}}/{\mathrm{cm}}^{-2})=25\mbox{--}26﹩ bin. Therefore, the model predictions are constant over these two absorption bins. Left panel: NH distributions for the lower-luminosity bin (log [L2−10/erg s−1] < 43.6); right panel: those for the higher-luminosity bin (log [L2−10/erg s−1] < 43.6). Both panels are normalized in the log (NH/cm−2) = 20–24 range. Bottom panels: total predicted number counts per square degree at each NH bin, integrated to redshift = 0.1 in each luminosity bin.
Other Images in This Article
Show More
Copyright and Terms & Conditions
© 2019. The American Astronomical Society. All rights reserved.