Image Details
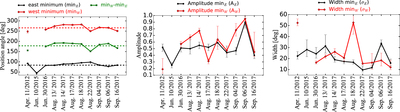
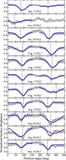
Caption: Figure 6.
Variations of the east and west minimum properties (i.e., results reported in Table 2). From left to right: location, amplitude, and width of each dip. In the left panel, the dashed lines correspond to the mean values including all epochs (i.e., ﹩\overline{{\min }_{{\rm{E}}}}=83\buildrel{\circ}\over{.} 7\pm 13\buildrel{\circ}\over{.} 7﹩, ﹩\overline{{\min }_{{\rm{W}}}}=265\buildrel{\circ}\over{.} 9\pm 13\buildrel{\circ}\over{.} 0﹩, and ﹩\overline{{\min }_{{\rm{W}}}-{\min }_{{\rm{E}}}}=178\buildrel{\circ}\over{.} 3\pm 14\buildrel{\circ}\over{.} 5﹩). For the western dip and the epochs of 2017 September 4 and 6, we take the location of the minimum and the width from the fit that takes the PA range from 236° to 300°, while for the amplitude, we take a PA range of 196°–350°, as for the rest of the fits.
Other Images in This Article
Copyright and Terms & Conditions
© 2018. The American Astronomical Society. All rights reserved.