Image Details
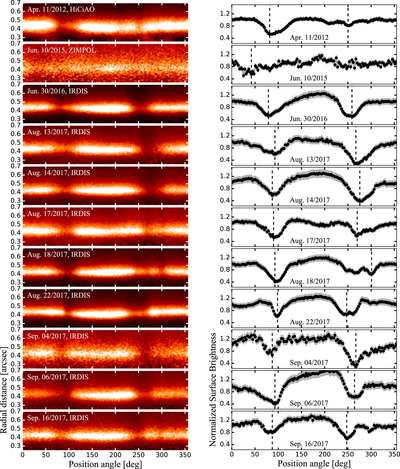
Caption: Figure 4.
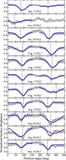
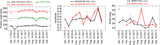
Left panels: radial mapping from 0.″25–0.″7 of all the panels shown in Figure 1. The color scale is linear and the maximum value taken in each case is 80% of the maximum. Right panel: azimuthal profile calculated from the mean values obtained between [0.35–0.50].″. The shaded areas correspond to the uncertainty of the data and come from the standard deviation in the radial and azimuth divided by the square root of the number of pixels. The data is normalized to the value at zero degrees in each case. The dashed lines correspond to the minimum value obtained from the image between 0° and 150°, and 200° to 350°. For the ZIMPOL data only one minimum is shown.
Other Images in This Article
Copyright and Terms & Conditions
© 2018. The American Astronomical Society. All rights reserved.