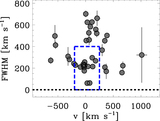
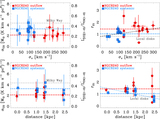
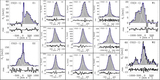
Image Details
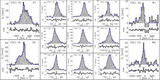
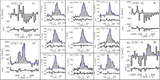
Caption: Figure 7.
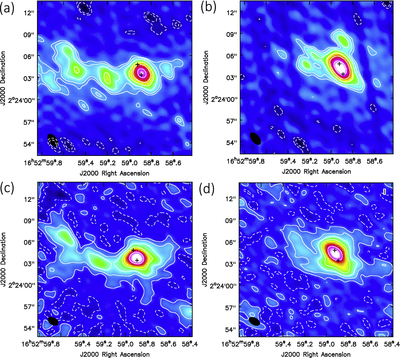
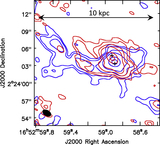
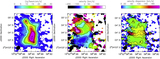
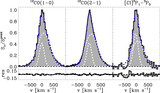
CO(1–0) (top row) and CO(2–1) (bottom row) interferometric maps of the outflow emission, integrated in the blue (a, c) and red (b, d) wings, by using the same velocity ranges as in Figure 1. The maps have matched spatial resolution (﹩\sim 1\buildrel{\prime\prime}\over{.} 2﹩, details in Section 2). Contours correspond to (−3σ, −2σ, 2σ, 3σ, 6σ, 12σ, 24σ, 48σ, 60σ) with 1σ = 0.33 mJy beam−1 in panel (a) and 1σ = 0.39 mJy beam−1 in panel (b); (−3σ, 3σ, 10σ, 24σ, 48σ, 200σ, 350σ) with 1σ = 0.33 mJy beam−1 in panel (c) and 1σ = 0.3 mJy beam−1 in panel (d). Similar to Figure 1, the black crosses indicate the VLBI positions of the AGNs from Hagiwara et al. (2011).
Other Images in This Article

Copyright and Terms & Conditions
© 2018. The American Astronomical Society. All rights reserved.