Image Details
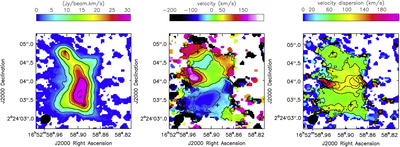
Caption: Figure 3.
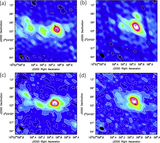
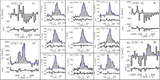
Intensity-weighted moment maps of the [C I](1–0) line emission in the merger nucleus. The maps were computed from the higher resolution ALMA+ACA merged data cube (see Section 2) by using the task immoments and by selecting the spectral range v ∈ (−200, 250) km s−1. Contours correspond to [−100, −50, 0, 50, 100, 150] km s−1 (moment 1, central panel) and [50, 80, 100, 110, 130, 170, 180] km s−1 (moment 2, right panel).
Other Images in This Article

Copyright and Terms & Conditions
© 2018. The American Astronomical Society. All rights reserved.
Copyright ©
2025 Astronomy Image Explorer. All Rights Reserved.