Image Details
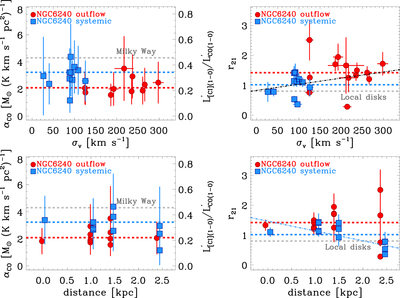
Caption: Figure 6.
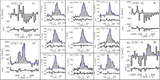
﹩{\alpha }_{\mathrm{CO}}﹩ (left) and r21 (right) as a function of the average velocity dispersion (top) and of the distance from the nucleus (bottom) of the corresponding molecular line components. A detailed explanation on how ﹩{\alpha }_{\mathrm{CO}}﹩ and r21 were calculated can be found in Section 3.3. The y-axis on the right side of the ﹩{\alpha }_{\mathrm{CO}}﹩ plots shows the corresponding [C I](1–0)/CO(1–0) line luminosity ratio. The horizontal blue and red dashed lines are the mean values reported in Table 2 for the systemic and outflow components, respectively. The gray lines indicate the Milky Way ﹩{\alpha }_{\mathrm{CO}}﹩ factor (Bolatto et al. 2013, left panels) and the average r21 = 0.8 measured in star-forming galaxies (Leroy et al. 2009, right panels). The best fits obtained from a Bayesian linear regression analysis following the method by Kelly (2007) are plotted using dot-dashed lines: black lines show the best fits to the total sample, whereas blue and red lines correspond to the fits performed separately on the systemic and outflowing components.
Other Images in This Article

Copyright and Terms & Conditions
© 2018. The American Astronomical Society. All rights reserved.