Image Details
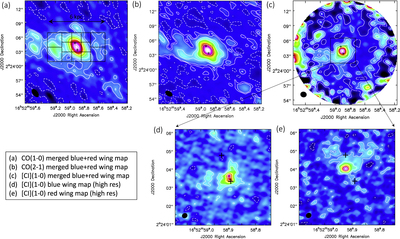
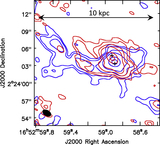
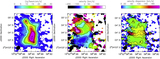
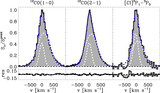
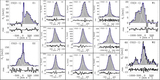
Caption: Figure 1.
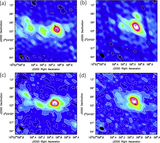
Extended NGC 6240 outflow observed using different molecular gas tracers. The outflow emission, integrated within v ∈ (−650, −200) km s−1 (blue wing) and v ∈ (250, 800) km s−1 (red wing) and combined together, is shown in the maps (a)–(c), respectively, for the CO(1–0), CO(2–1), and [C I](1–0) transitions. The three maps have matched spatial resolution (﹩\sim 1\buildrel{\prime\prime}\over{.} 2﹩, details in Section 2). Contours correspond to (−3σ, 3σ, 6σ, 12σ, 24σ, 48σ, 150σ) with 1σ = 0.14 mJy beam−1 in panel (a); (−3σ, 3σ, 6σ, 24σ, 48σ, 200σ, 400σ) with 1σ = 0.23 mJy beam−1 in panel (b); (−3σ, 3σ, 6σ, 12σ, 24σ, 48σ) with 1σ = 1.23 mJy beam−1 in panel (c). Panels (d) and (e) show the maps of the [C I](1–0) blue and red wings at the original spatial resolution of the ALMA Band 8 data (﹩0\buildrel{\prime\prime}\over{.} 24﹩, details in Section 2). Contours correspond to (−3σ, 3σ, 6σ, 12σ, 18σ, 20σ) with 1σ = 1.1 mJy beam−1 in panel (d) and 1σ = 1 mJy beam−1 in panel (e). The black crosses indicate the VLBI positions of the AGNs from Hagiwara et al. (2011). The synthesized beams are shown at the bottom-left of each map. The grid encompassing the central ﹩12^{\prime\prime} \times 6^{\prime\prime} ﹩ region and employed in the spectral analyses presented in Sections 3.2 and 3.3 is drawn in panel (a).
Other Images in This Article
Copyright and Terms & Conditions
© 2018. The American Astronomical Society. All rights reserved.