Image Details
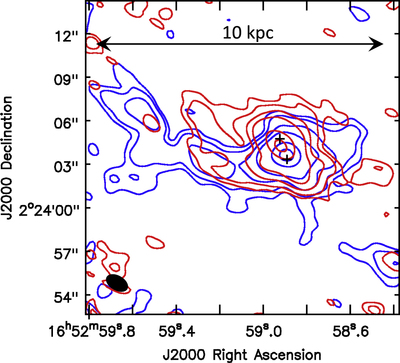
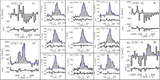
Caption: Figure 2.
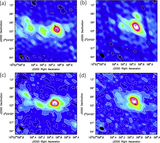
Comparison between the CO(2–1) blue and red wing emissions in NGC 6240. For visualization purposes, only positive contours starting from 5σ are shown, with 1σ = 0.33 mJy beam−1 for the blue wing (blue contours) and 1σ = 0.3 mJy beam−1 for the red wing (red contours). The corresponding interferometric maps including negative contours are displayed in Appendix A (Figure 7).
Other Images in This Article

Copyright and Terms & Conditions
© 2018. The American Astronomical Society. All rights reserved.
Copyright ©
2025 Astronomy Image Explorer. All Rights Reserved.