

Image Details
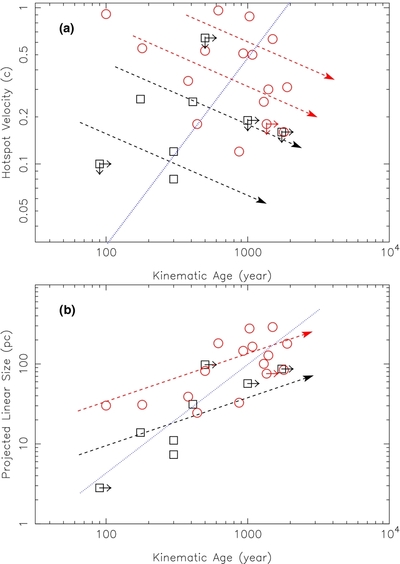
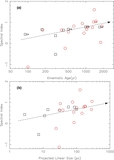
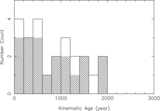
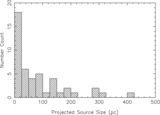
Caption: Figure 7.
Variation of the linear size and the separation velocity with kinematic age. (a) Both source groups (high and low radio power) are consistent with hotspot separation velocity decreasing with age. The predicted evolution of the sources follows a v HS∝ T −2/5 kin relation (dashed arrows). (b) The CSO linear size shows an expected increase with age. The predicted variation for individual sources with constant power is D∝ T 3/5 kin as indicated with dashed arrows. As a group the older sources also have larger sizes as D∝ T 1.5 kin (dotted line).
Other Images in This Article
Copyright and Terms & Conditions
© 2012. The American Astronomical Society. All rights reserved.

Copyright ©
2026 Astronomy Image Explorer. All Rights Reserved.
