

Image Details
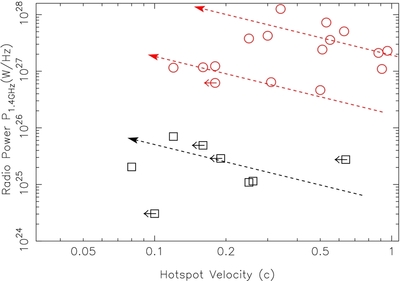
Caption: Figure 4.
Variation of the CSO radio power vs. the hotspot separation velocity. As a group, the sources with higher v HS generally have a higher radio power P rad and also a higher source power P src. Individual sources are predicted to evolve from high- v HS and low- P rad to low- v HS and high- P rad with time as P rad∝ v −1 HS. Symbols indicate high-power (circles) and low-power (squares) CSOs. Arrows on the symbols indicate upper limits.
Other Images in This Article
Copyright and Terms & Conditions
© 2012. The American Astronomical Society. All rights reserved.

Copyright ©
2026 Astronomy Image Explorer. All Rights Reserved.
