

Image Details
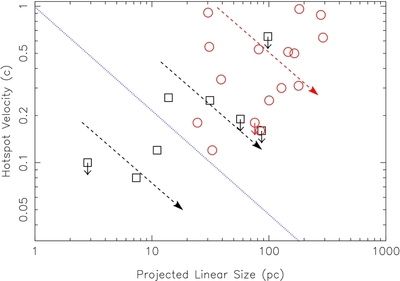
Caption: Figure 5.
Variation of the hotspot separation velocity vs. the projected linear size. The dashed arrows v HS∝ D −2/3 indicate the predicted evolution for a source with constant power. The dotted line represents the lower boundary for the jet flow to continue to accelerate at the ISM–IGM transition point. CSO close to and below this line will not survive as double sources beyond the ISM. Projection effects for the CSOs shift data points diagonally toward the origin.
Other Images in This Article
Copyright and Terms & Conditions
© 2012. The American Astronomical Society. All rights reserved.

Copyright ©
2026 Astronomy Image Explorer. All Rights Reserved.
