

Image Details
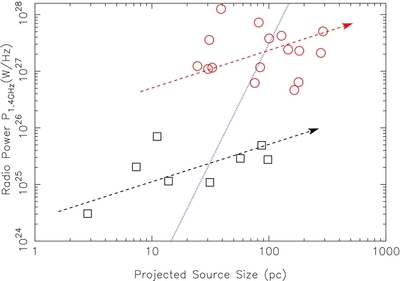
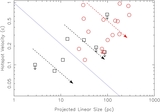
Caption: Figure 3.
Variation of the CSO radio power with projected linear source size. Symbols indicate high (red circles) and low (black squares) radio powers. Sources with constant jet power P src have a predicted evolution P rad∝ D 2/3 indicated by the dashed arrows. The general trend in the distribution is represented by a P rad∝ D 4 relation (dotted line).
Other Images in This Article
Copyright and Terms & Conditions
© 2012. The American Astronomical Society. All rights reserved.

Copyright ©
2026 Astronomy Image Explorer. All Rights Reserved.
