Image Details
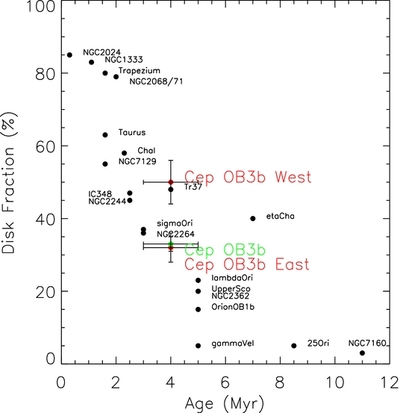
Caption: Figure 6.
Disk fraction vs. age for young stellar clusters in the literature. This plot is taken from Figure 14 from Hernandez et al. (2008) and augmented with the disk fractions and assumed age of the Cep OB3b sub-clusters in red and the average disk fraction and assumed age of the entire Cep OB3b region in green.
Other Images in This Article
Show More
Copyright and Terms & Conditions
© 2012. The American Astronomical Society. All rights reserved.
Copyright ©
2026 Astronomy Image Explorer. All Rights Reserved.