Image Details
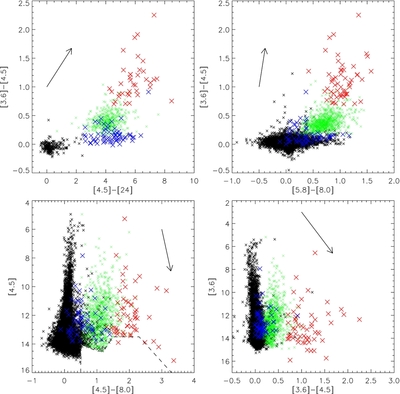
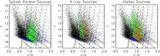
Caption: Figure 2.
IRAC/MIPS color–color and color–magnitude diagrams of Cep OB3b. The colors of the markers correspond to the classifications determined with the three phases from Section 3. Red denotes Class I objects, green denotes Class II objects, blue denotes transition disk objects, and black denotes Class III/field stars. The dashed line in the [4.5]−[8] vs. [4.5] diagram (lower left plot) separates the region occupied by AGN contaminants. All objects in this region were flagged as contaminants and deleted. They were later included only if they have bright MIPS 24 μm detection ([24] < 7) or very red IRAC/MIPS colors ([3.6] − [5.8] > 0.5 and [4.5] − [24] > 4.5 and [8.0] − [24] > 4). The black arrows show the reddening vectors for an A k = 5.
Other Images in This Article
Show More
Copyright and Terms & Conditions
© 2012. The American Astronomical Society. All rights reserved.