Image Details
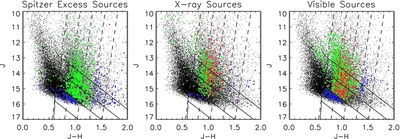
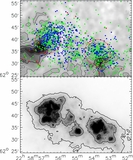
Caption: Figure 5.
J vs. J − H color–magnitude diagram of Cep OB3b. The black dots are sources in the Cep OB3b field with photometry that meets the photometric error threshold described in the text, while the green, red, and blue dots are further selected as young sources based on Spitzer, Chandra, and/or visible photometry. The red and green sources are excess and non-excess sources, respectively, that satisfy the magnitude–extinction requirements for the disk fraction analysis in Section 5, while the blue sources do not. The upward sloping dashed lines represent A V values of 0, 2, 4, 6, and 8 mag. The downward sloping solid lines are reddening vectors for a m J = 13.01, 13.94, 14.75, and 15.81 star. These magnitudes correspond to a 0.7, 0.35, 0.2, and 0.08 M ☉ star at an age of 3 Myr at the adopted distance of 700 pc using the model of Baraffe et al. (1998). Each panel shows a different selection method. From left to right: Spitzer infrared excess sources, Chandra X-ray sources, and visible wavelength-selected sources. The criteria for each selection method are described in the text.
Other Images in This Article
Show More
Copyright and Terms & Conditions
© 2012. The American Astronomical Society. All rights reserved.