Image Details
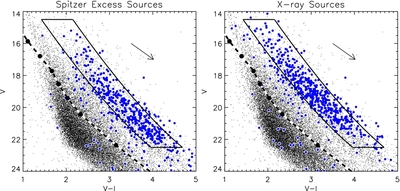
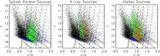
Caption: Figure 3.
V vs. V − I color–magnitude diagram of Cep OB3b. The black dots are sources in the Cep OB3b field with photometry that meets the photometric error threshold described in the text, and the blue dots are sources classified as pre-MS. The region bounded by the black curve represents the YSO isochrone as described in the text. The dashed white and black line are the ZAMS of Siess et al. (2000), and the black arrow corresponds to 1 mag of extinction using the reddening law of Rieke & Lebofsky (1985). The left plot shows sources classified based using Spitzer colors and the right plot shows sources classified based on their detection in X-rays.
Other Images in This Article
Show More
Copyright and Terms & Conditions
© 2012. The American Astronomical Society. All rights reserved.