Image Details
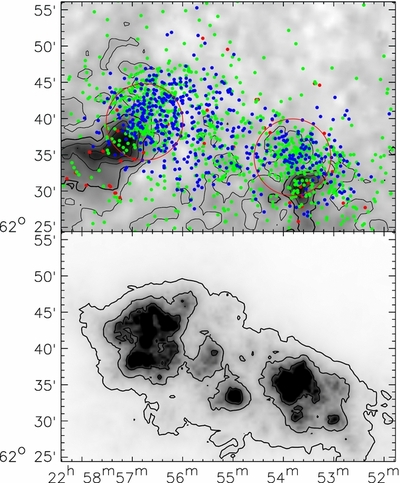
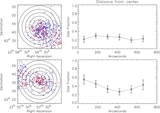
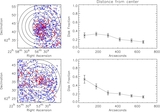
Caption: Figure 4.
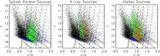
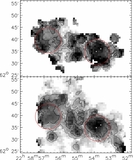
Top: gray-scale extinction map of same region with countours corresponding to A V of 2.5, 5.0, 7.5, and 10. The red and green dots are Spitzer classified young stars with circumstellar excess indicative of an envelope and a disk, respectively, and the blue dots are Chandra detected young stars with increased coronal activity. The large red circles show the adopted boundaries of the sub-clusters. Bottom: YSO surface density map created using IR, X-ray, and visible-selected YSO candidates. YSO surface density was calculated using the 11 nearest neighbors. Contours correspond to YSO surface densities of 10, 30, and 70 stars pc −2.
Other Images in This Article
Show More
Copyright and Terms & Conditions
© 2012. The American Astronomical Society. All rights reserved.