Image Details
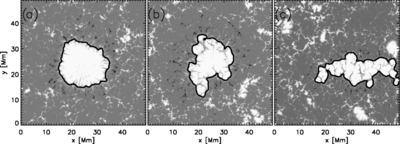
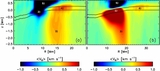
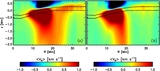
Caption: Figure 14.
Influence of bottom boundary condition on sunspot decay. Panel (a) shows the initial state at t = 8.8 hr from which we started the simulation run with open boundary condition, panel (b) shows the result for the closed boundary condition at t = 46.4 hr, and panel (c) for the open boundary condition at t = 46.3 hr. Presented is a magnetogram at τ = 1 together with a mask we used to compute the flux and area of the spot. The values are (a) 9.1 × 10 21 Mx, (b) 7.8 × 10 21 Mx, and (c) 6.5 × 10 21 Mx for flux and (a) 275 Mm 2, (b) 257 Mm 2, and (c) 236 Mm 2 for the area.
Other Images in This Article
Show More
Copyright and Terms & Conditions
© 2011. The American Astronomical Society. All rights reserved.