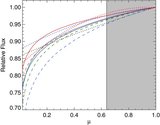
Image Details
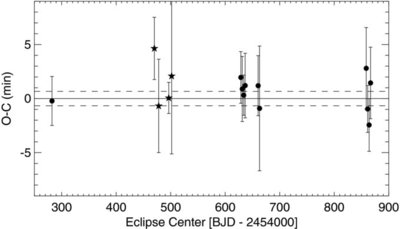
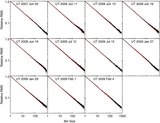
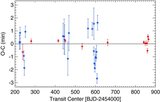
Caption: Figure 9.
Observed minus calculated secondary eclipse times using the best-fit period from the transit fits and allowing the phase of the secondary eclipse to vary freely. Filled circles are eclipse times reported in this paper, and filled stars are additional 3.6 and 4.5 μm eclipse times from Stevenson et al. (2010). The solid line indicates the best-fit phase, with ±1σ uncertainties plotted as dashed lines.
Other Images in This Article
Show More
Copyright and Terms & Conditions
© 2011. The American Astronomical Society. All rights reserved.
Copyright ©
2025 Astronomy Image Explorer. All Rights Reserved.