Image Details
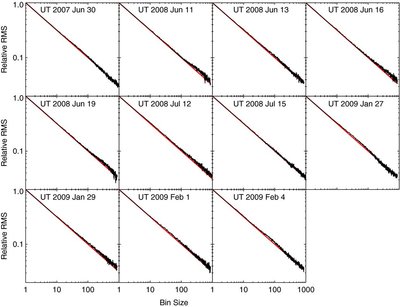
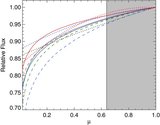
Caption: Figure 7.
Standard deviation of residuals vs. bin size for the eleven secondary eclipses observed with Spitzer, arranged in chronological order. The red curve shows the predicted root- n scaling expected for Gaussian noise, and the lack of any excess noise for large bin sizes suggests that these light curves should be well described by the standard MCMC error analysis.
Other Images in This Article
Show More
Copyright and Terms & Conditions
© 2011. The American Astronomical Society. All rights reserved.
Copyright ©
2025 Astronomy Image Explorer. All Rights Reserved.