Image Details
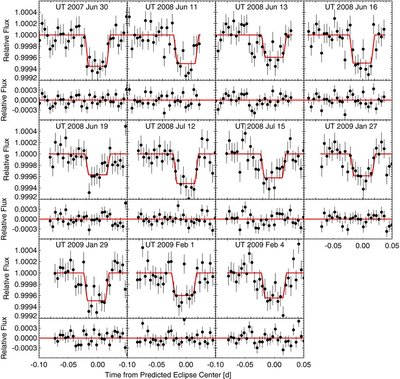
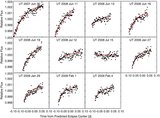
Caption: Figure 6.
Photometry for eleven 8 μm secondary eclipses of GJ 436b, arranged in chronological order. Data have been binned in 6.4 minute bins, and the best-fit eclipse curve for each visit is overplotted in red. The residuals for each visit are shown in the panels below the eclipses.
Other Images in This Article
Show More
Copyright and Terms & Conditions
© 2011. The American Astronomical Society. All rights reserved.
Copyright ©
2025 Astronomy Image Explorer. All Rights Reserved.