Image Details
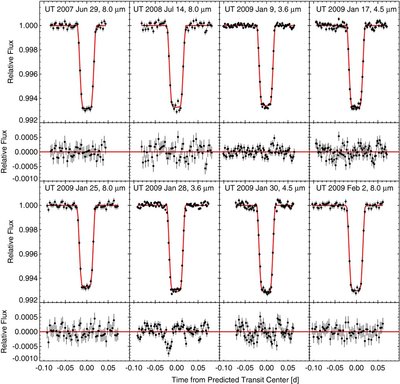
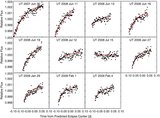
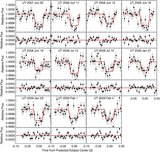
Caption: Figure 2.
Photometry for the eight observed transits of GJ 436b after the best-fit corrections for instrument effects are removed, arranged in chronological order. Data have been binned in either 2.7 minute (3.6, 4.5 μm) or 4.3 minute (8.0 μm) bins. Best-fit transit curves are overplotted in red, and the residuals from each fit are shown in the lower panel. In this plot, we have assumed a constant ephemeris for the planet rather than using the best-fit transit times. Note that although the out-of-transit residuals for the second 3.6 μm observation on UT 2009 January 28 appear to be relatively Gaussian, there are additional variations during the transit that are not well accounted for by the best-fit transit light curve. These variations are likely due to occultations of spots or faculae by the planet. The residuals for the 4.5 μm transit observed on UT 2009 January 30 display excess correlated noise both in and out of transit, most likely due to an imperfect correction for the sharp flux variations caused by the star's location at the edge of a pixel.
Other Images in This Article
Show More
Copyright and Terms & Conditions
© 2011. The American Astronomical Society. All rights reserved.