Image Details
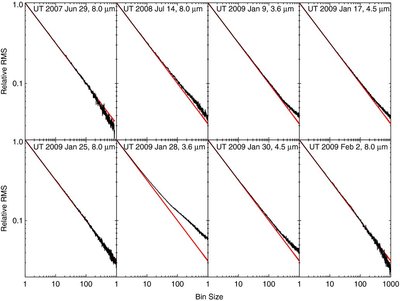
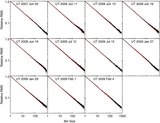
Caption: Figure 3.
Standard deviation of residuals vs. bin size for the eight transits observed with Spitzer, arranged in chronological order. Observations were taken at 8.0, 8.0, 3.6, and 4.5 μm (top row, left to right), 8.0, 3.6, 4.5, and 8.0 μm (bottom row, left to right), respectively. The red curve shows the predicted root- n scaling expected for Gaussian noise.
Other Images in This Article
Show More
Copyright and Terms & Conditions
© 2011. The American Astronomical Society. All rights reserved.
Copyright ©
2025 Astronomy Image Explorer. All Rights Reserved.