

Image Details
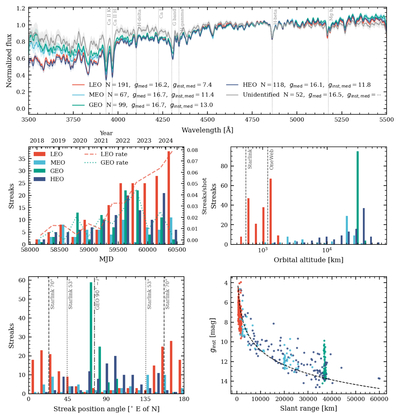
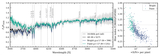
Caption: Figure 5.
Summary of the 475 identified satellite streaks in the HETDEX PDR1 catalog. Top: median-normalized streak spectra stacked by orbit class (LEO, MEO, GEO, HEO, and the 52 unidentified streaks). Median measured g and ginst values are given for each identified class; the unidentified class has no ginst value. Middle left: identified streaks per semiannual bin versus epoch, by orbit class. The contamination fraction (streaks per shot) for LEO and GEO populations is shown with red dashed and green dotted lines, respectively. Middle right: height above the Earth ellipsoid at crossing, by orbit class. Bottom left: streak position angle (folded to 0°–180°, east of north), by orbit class. Vertical lines mark the ascending/descending azimuths of the Starlink 53° (dotted) and 70° (dashed) shells at the HET latitude (﹩+30\mathop{.}\limits^{^\circ }7﹩); the dotted–dashed line at 76° marks 90° − i for the median inclination i = 14° of the GEO-class identifications. Bottom right: instantaneous SDSS-g magnitude versus topocentric slant range, by orbit class. The dashed curve is the inverse-square locus anchored to the sample median g(550 km).
Other Images in This Article
Copyright and Terms & Conditions
© 2026. The Author(s). Published by the American Astronomical Society.

