

Image Details
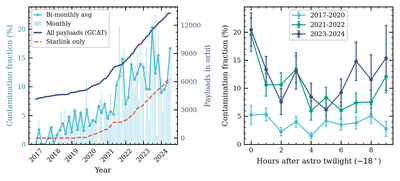
Caption: Figure 2.
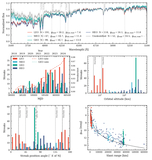
Satellite contamination in HETDEX PDR1. Left: growth over the survey. Light blue bars show the monthly fraction of observations containing at least one satellite streak, and light blue points the bimonthly average (left axis); the dark blue and red curves give the number of all active payloads and Starlink payloads in orbit, respectively, from GCAT (J. C. McDowell 2020b; right axis). The contamination fraction rises from a few percent early in the survey to monthly values above 20% by 2023, broadly tracking the growth of the LEO population. Right: contamination fraction versus hours after astronomical twilight (when the Sun falls 18 deg below the horizon for the HET), split into survey epochs (2017–2020, 2021–2022, 2023–2024; 1 hr bins, binomial errors). The latter epochs show the highest contamination values near twilight, but the values remain significant all night.
Other Images in This Article
Copyright and Terms & Conditions
© 2026. The Author(s). Published by the American Astronomical Society.

