

Image Details
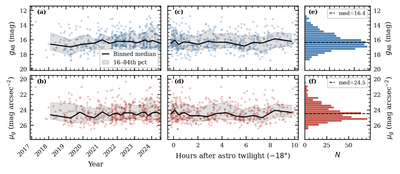
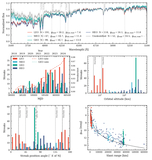
Caption: Figure 3.
Photometric properties of satellite streaks measured from HETDEX spectra. Panels (a) and (b) show SDSS g-band magnitude and surface brightness as a function of year. Panels (c) and (d) show the same quantities as a function of time after astronomical twilight. Points show individual satellite streaks, black curves show binned medians, and shaded regions indicate the 16th–84th percentile range. Panels (e) and (f) show the corresponding distributions, with dashed lines marking the median values of gAB = 16.4 and μg = 24.5 mag arcsec−2. The broad distributions reflect variations in satellite altitude, phase angle, apparent trail length, and observing geometry.
Other Images in This Article
Copyright and Terms & Conditions
© 2026. The Author(s). Published by the American Astronomical Society.

