

Image Details
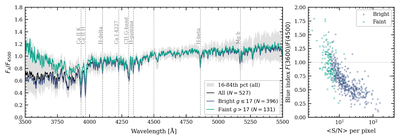
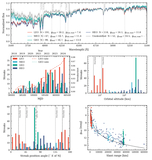
Caption: Figure 4.
Spectral properties of the HETDEX satellite-streak sample. Left: median-stacked spectra, normalized to unity at 4500 Å, for the full sample (black), the bright subsample (g ≤ 17; dark blue), and the faint subsample (g > 17; teal). Dashed vertical lines mark the wavelengths of prominent solar Fraunhofer features (Ca II H&K, the CH G band, the Balmer series, and Mg b) for reference; the smooth continua are consistent with reflected sunlight. Right: the per-streak blue index, the ratio of flux near 3600 Å to that near 4500 Å, versus mean spectral signal-to-noise ratio for the bright (dark blue) and faint (teal) subsamples.
Other Images in This Article
Copyright and Terms & Conditions
© 2026. The Author(s). Published by the American Astronomical Society.

