

Image Details
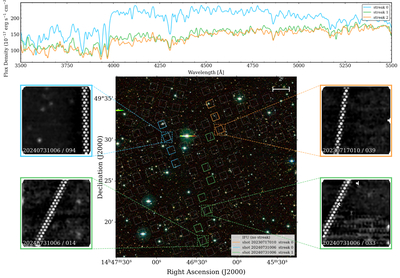
Caption: Figure 1.
Satellite-streak detections in HETDEX overlaid on a Legacy Survey DR9 grz image (≈22′ × 22′; R.A. = 221﹩\mathop{.}\limits^{{\unicode{x000b0}}}﹩596, decl. = + 49﹩\mathop{.}\limits^{{\unicode{x000b0}}}﹩445). IFU footprints are color–coded by satellite trail: orange (shotid=20230717010), cyan and green (two separate streaks in shotid=20240731006). Zoom panels show four IFUs (20240731006/094, 20240731006/014, 20230717010/039, and 20240731006/033) with their spaxels spectrally collapsed onto an image, revealing the characteristic dotted-line pattern of satellite trails sampled by the three-dither exposure fiber grid. Top: summed spectra over all IFUs in an observation for each streak. The spectra are consistent with reflected sunlight from LEO satellites.
Other Images in This Article
Copyright and Terms & Conditions
© 2026. The Author(s). Published by the American Astronomical Society.

