

Image Details
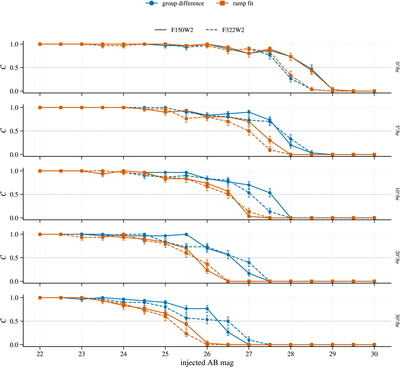
Caption: Figure 9.
Injection–recovery completeness ﹩{ \mathcal C }﹩ as a function of injected AB magnitude, shown separately for each angular rate of motion v (0, 5, 10, 20, 30 arcsec hr–1; one row per rate). In each panel, blue circles show the group-difference calibration and orange squares show the standard ramp-fit pipeline; solid lines are F150W2 and dashed lines are F322W2. Error bars are binomial confidence intervals on the recovered fraction at each magnitude/rate/filter cell (30 injected sources per cell). The dotted horizontal line marks 50% completeness. We denote the magnitude at which a given curve crosses this line as m50%. At zero apparent rate, the two calibration branches are statistically indistinguishable (m50% differs by ≤0.05 mag in both filters), as expected since group differencing and standard ramp fitting are mathematically equivalent for a stationary source. As the angular rate increases, group-difference calibration recovers systematically fainter sources than the ramp-fit pipeline, with the increase in m50% growing from ∼0.4–0.7 mag at 5″ hr–1 to ∼0.9–1.3 mag at 30″ hr–1 in both filters.
Other Images in This Article
Show More
Copyright and Terms & Conditions
© 2026. The Author(s). Published by the American Astronomical Society.

